Supply Chain Interruptions=Shopping Looks Different These Days
When the pandemic hit more than 18 months ago, we experienced our first taste of supply chain interruptions and product shortages. Not only do these shortages continue to this day, the issues — likely due to products stuck on container ships, raw material shortages, and a lack of associates to stock warehouses and store floors — have grown to impact the entire supply chain.
We set out to examine how this far-reaching issue is affecting the relationship between shoppers and retailers and between consumers and brands.
In addition to fielding a survey among a representative sample of receipt-verified shoppers, Prodege also leveraged our geo-fencing technology and research solutions to survey respondents while they were in-store in order to learn about shelf conditions, out of stock items, and their general store experience.
Respondents submitted photos to illustrate in-store environments:
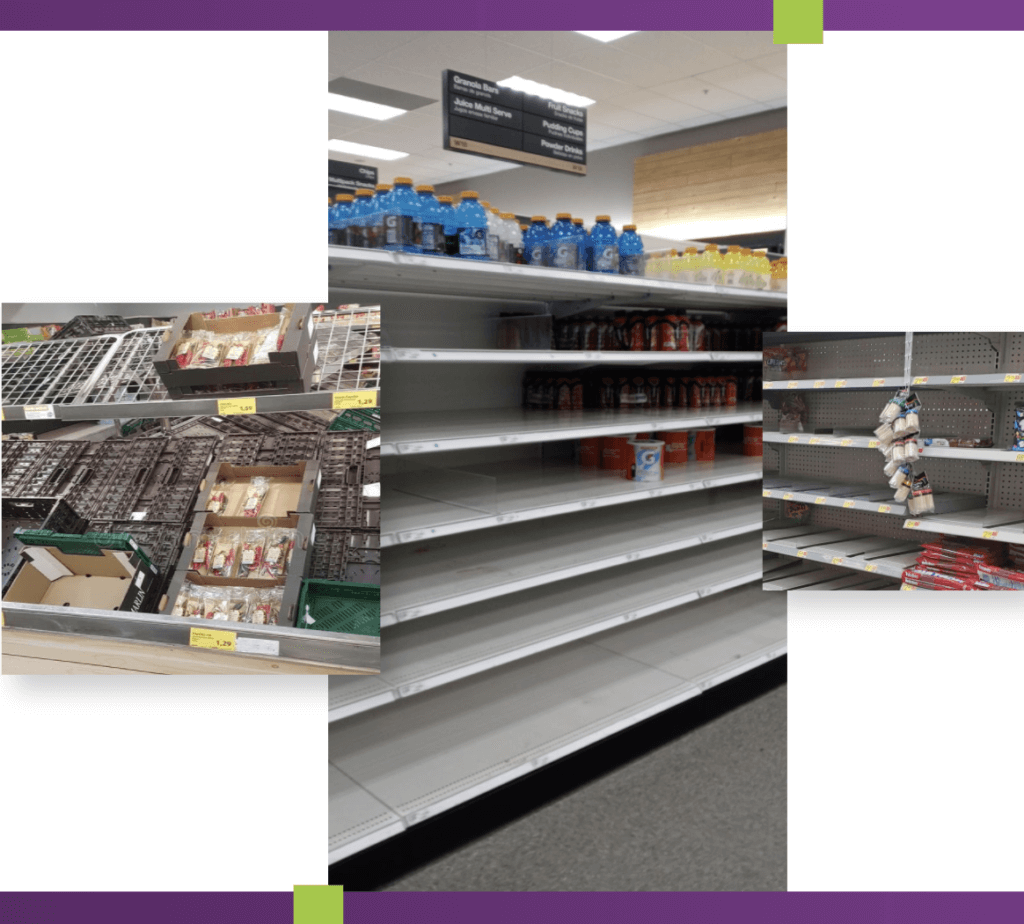
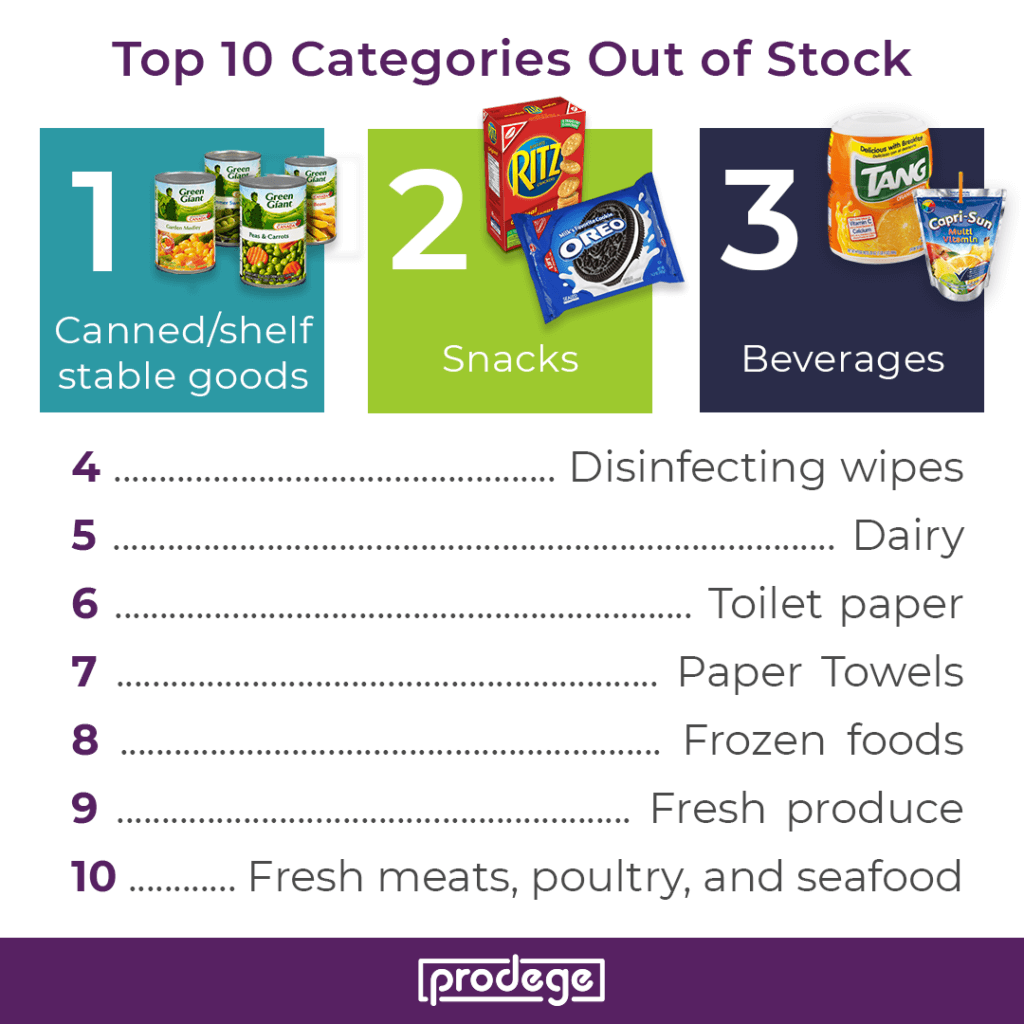
As demonstrated by the above photos and below data, these days, it’s more than just toilet paper and cleaning supplies that are missing from store shelves:
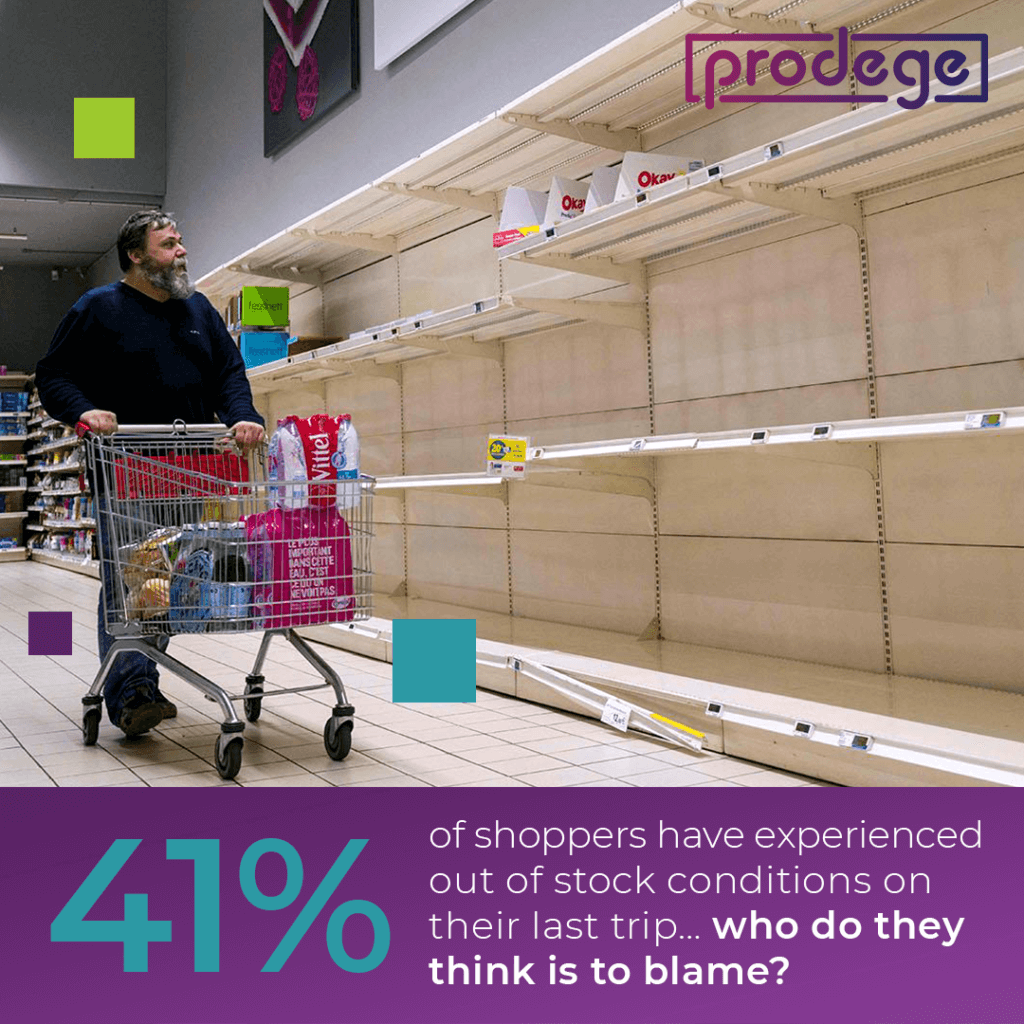
Who is to Blame For Product Shortages?
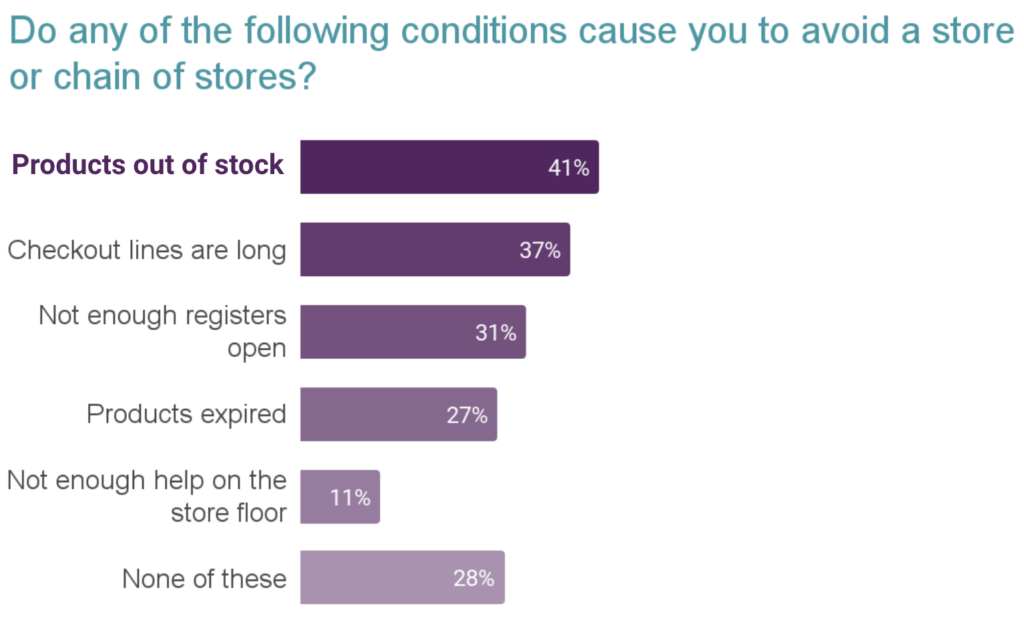
We found that shoppers are equally likely to blame manufacturers and retailers for out of stock items, and 41% indicate they will avoid stores who don’t have products in stock.
Other reasons for this include long checkout lines and not enough registers open.
With these ongoing supply chain issues proving to negatively impact the shopper experience, diminish brand loyalty, and drive lost sales, we were curious to see how these challenges might be mitigated. Shoppers we consulted stress communication and prefer the following solutions:
- Post signage at the shelf indicating when the item will be available (72%)
- Offer to notify when product is in stock (66%)
- Offer to order the product for delivery (65%)
- Use app or website to notify of out of stocks (63%)
- Post signage at front of store re: OOS (62%)
- Limit # of items shoppers can buy (60%)
With Halloween and the holidays approaching, many sweets will be consumed. Read more about what drives sales among verified purchasers of treats here!

Rachel Kaye
Share This Article
Recent Press Releases
Prodege Unveils Conversational AI Within Pollfish Platform, Empowering All Customers to Access Real Human Insights at ScaleEL SEGUNDO, Calif., May 21, 2025 (GLOBE NEWSWIRE) -- Prodege, a leading provider of consumer insigh [...]
FAA Cuts, Airline Incidents Spark Consumer Fear: 55% Report Rising Anxiety About Air TravelA new Prodege study reveals majority of travelers report increased anxiety about flying amid recent [...]
Prodege to Deliver Over $250 Million in Revenue to Mobile Gaming Clients in 2025 Through Rewarded User AcquisitionStrategic Team Expands to Assure Gaming Leadership EL SEGUNDO, Calif., Jan. 30, 2025 (GLOBE [...]